Throughout 2022, the share of homes that sold for less than asking price increased following interest rate hikes and falls in home prices.
However, the trend has reversed in recent months and in some regions the proportion of discounted homes has declined substantially.
The rate of vendor discounting - defined as the proportion of properties that sell below asking price - has been trending downwards since December last year.
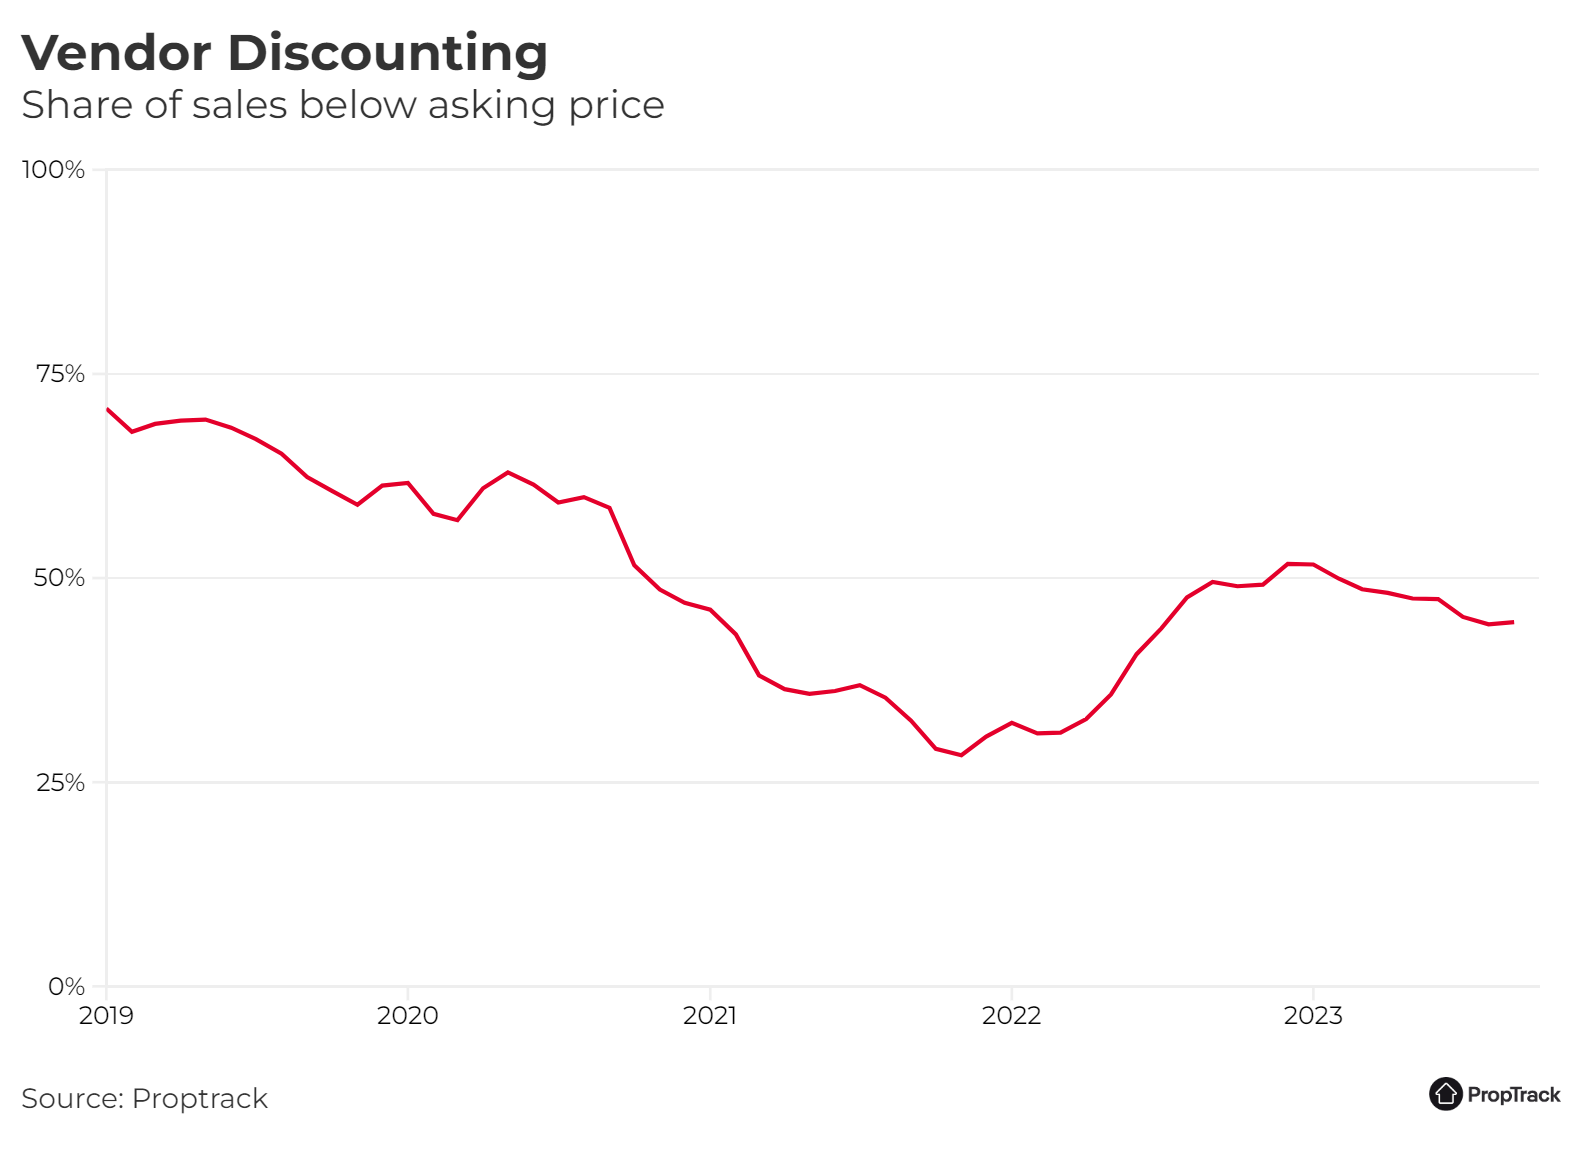
While almost twice as many vendors are selling their properties at a discount compared to the period of peak price growth in late 2021, the prevalence of discounting is still below pre-pandemic times.
Vendor discount rates tend to follow price growth trends and their recent decline illustrates how the property market has shifted in the past nine months.
National home prices reached a new price peak in September after nine months of consecutive growth, according to Proptrack's Home Price Index.
Fewer new listings, strong demand from buyers and a shortage of rentals are some of the main drivers of this growth. These factors are also contributing to the decreasing share of properties sold below asking price.
The recovery in the market has improved selling conditions for vendors, making them more likely to accept an offer only when it is above or equal to the asking price.
To understand where conditions are now better for sellers, we can look at the regions where the proportion of sales sold at a discount has declined the most over the year to September 2023.
| SA4 | Share of sales below asking price - September 2022 | Share of sales below asking price - September 2023 | Percentage point change |
| Sydney - Inner West | 68.85% | 31.15% | -37.70 |
| Sydney - Blacktown | 57.03% | 26.96% | -30.07 |
| Sydney - North Sydney and Hornsby | 54.55% | 29.23% | -25.32 |
| Sydney - Eastern Suburbs | 55% | 29.73% | -25.27 |
| Perth - South East | 50.85% | 25.70% | -25.15 |
| Perth - North East | 44.81% | 19.70% | -25.11 |
| Sydney - Northern Beaches | 50.72% | 26.56% | -24.16 |
| Sydney - Sutherland | 39.47% | 15.71% | -23.76 |
| Brisbane - North | 54.46% | 31.25% | -23.21 |
| Brisbane - West | 57.69% | 34.62% | -23.07 |
In Sydney - Inner West, 31.2% of properties were sold below asking price compared to 68.9% a year before. This reflects a 37.7 percentage point (ppt) decrease in discounting, the highest among all SA4 regions.
A larger proportion of vendors in Blacktown, North Sydney and Hornsby and the Eastern suburbs in Sydney saw their homes sell at or above asking price as well. The share of discounted properties fell by 30ppt, 25.3ppt and 25.3ppt respectively.
Fewer sellers in Perth - South East and Perth - North East also sold their properties below asking price compared to September last year.
All these SA4 regions are located in capitals that have experienced some of the highest price growth over the past year. Sydney, Perth and Brisbane have seen prices increase by 7%, 6% and 9% respectively, a likely result of increasing competition.
Property market conditions have improved throughout 2023 with home prices continuing to trend upwards. Seller and buyer confidence has also grown following a slow-down in rate rises and vendor discounting may continue to decrease as a result.
We expect supply to remain tight despite recent improvements in Sydney and Melbourne, and demand to remain elevated in the coming months as we continue to face shortfalls in new housing, a challenged rental market and strong migration.