Spring selling season caps off busier than last year.
Executive summary
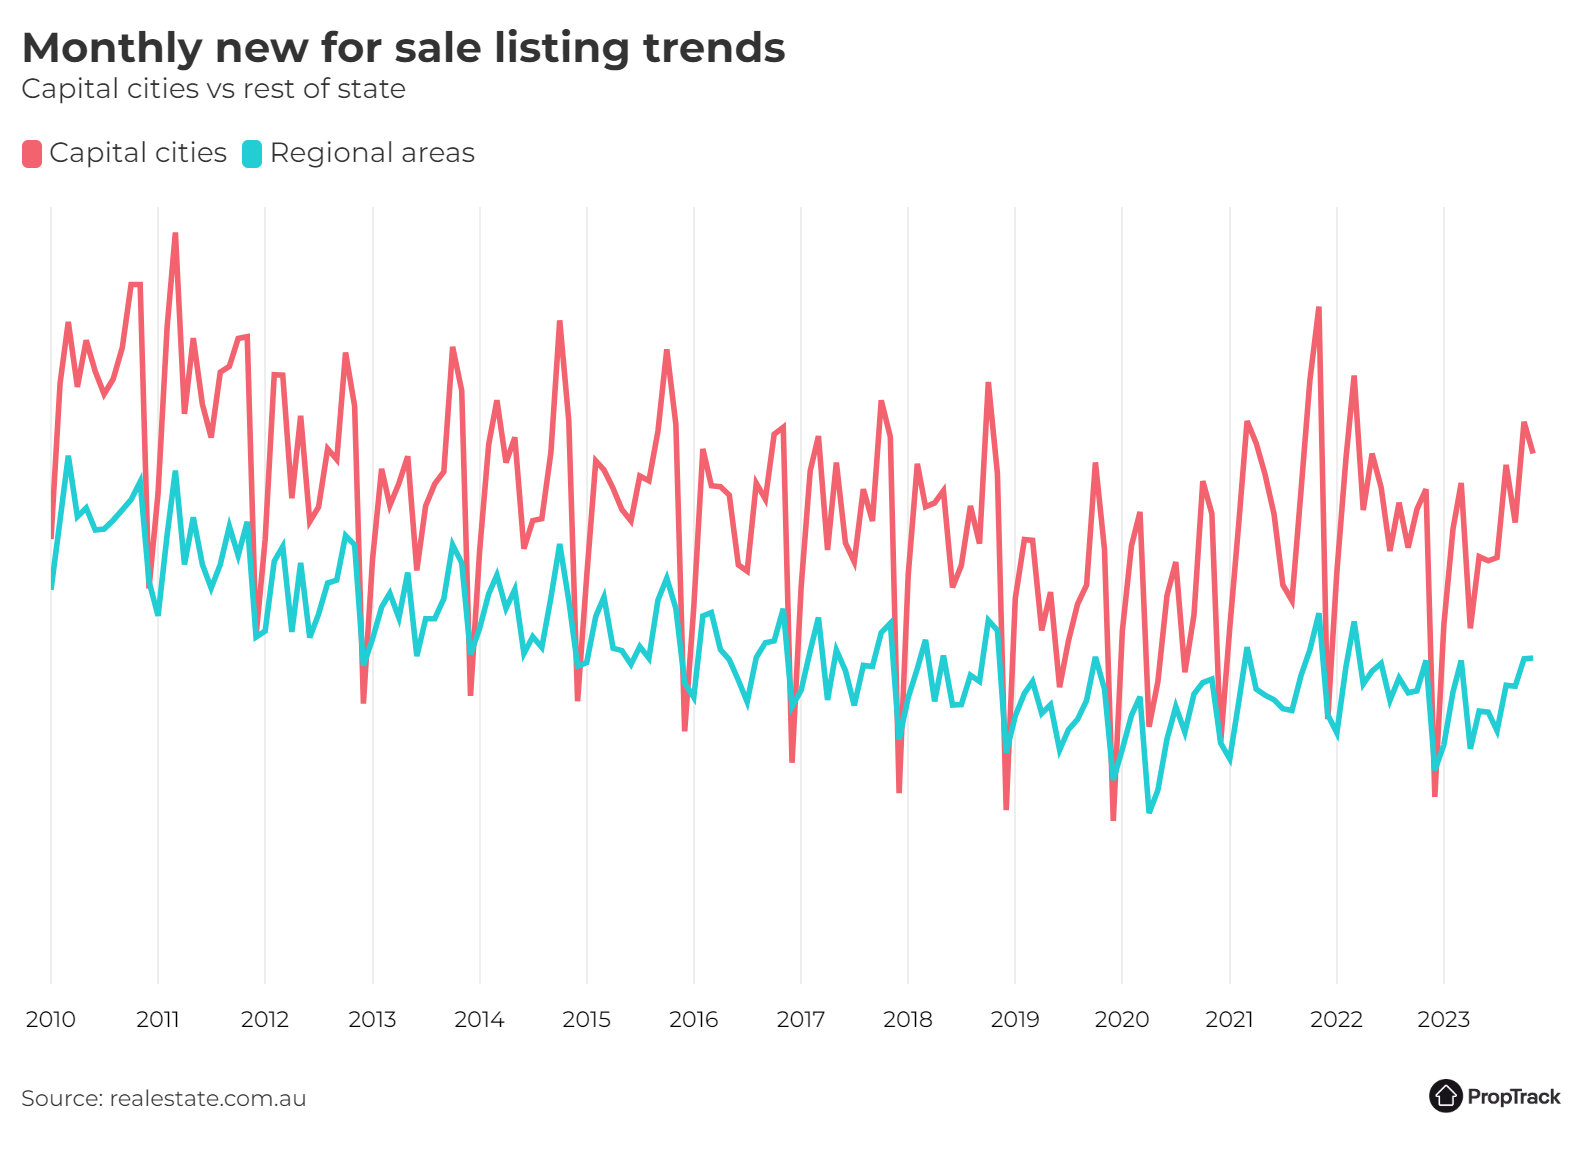
Property markets slowed a little in November to end the spring selling season following their usual October seasonal peak. The number of new listings nationally on realestate.com.au was down 3.5% month-on-month in November – consistent with the typical end-of-spring decline. Even so, activity was still 4.7% higher than the pace seen last year amid the slower conditions of spring 2022.
As has been the case since mid-winter, both Sydney and Melbourne saw a much busier November this year than last. New listings in Sydney were 11.9% higher than at the same time last year; in Melbourne they were up 19.1% year-on-year. After a very quiet spring in both cities last year, activity this spring has been more in line with what has been typical over the past decade.
The number of new listings on realestate.com.au were 4.7% higher in November than a year earlier. Picture: Getty
The same was not true across the other capitals. Almost all saw fewer new listings this year than last, with Canberra the only other city recording more new listings than a year ago.
Regional areas saw a modest increase in activity for the end of spring, with 0.3% more new listings than in October. Unlike the combined capital cities, November, not October, is usually the busiest month of the spring selling season for most regional markets. That modest increase helped keep activity just ahead of the pace set last year, with 0.7% more new listings this year than last, led by regional Victoria (+13.4% year-on-year).
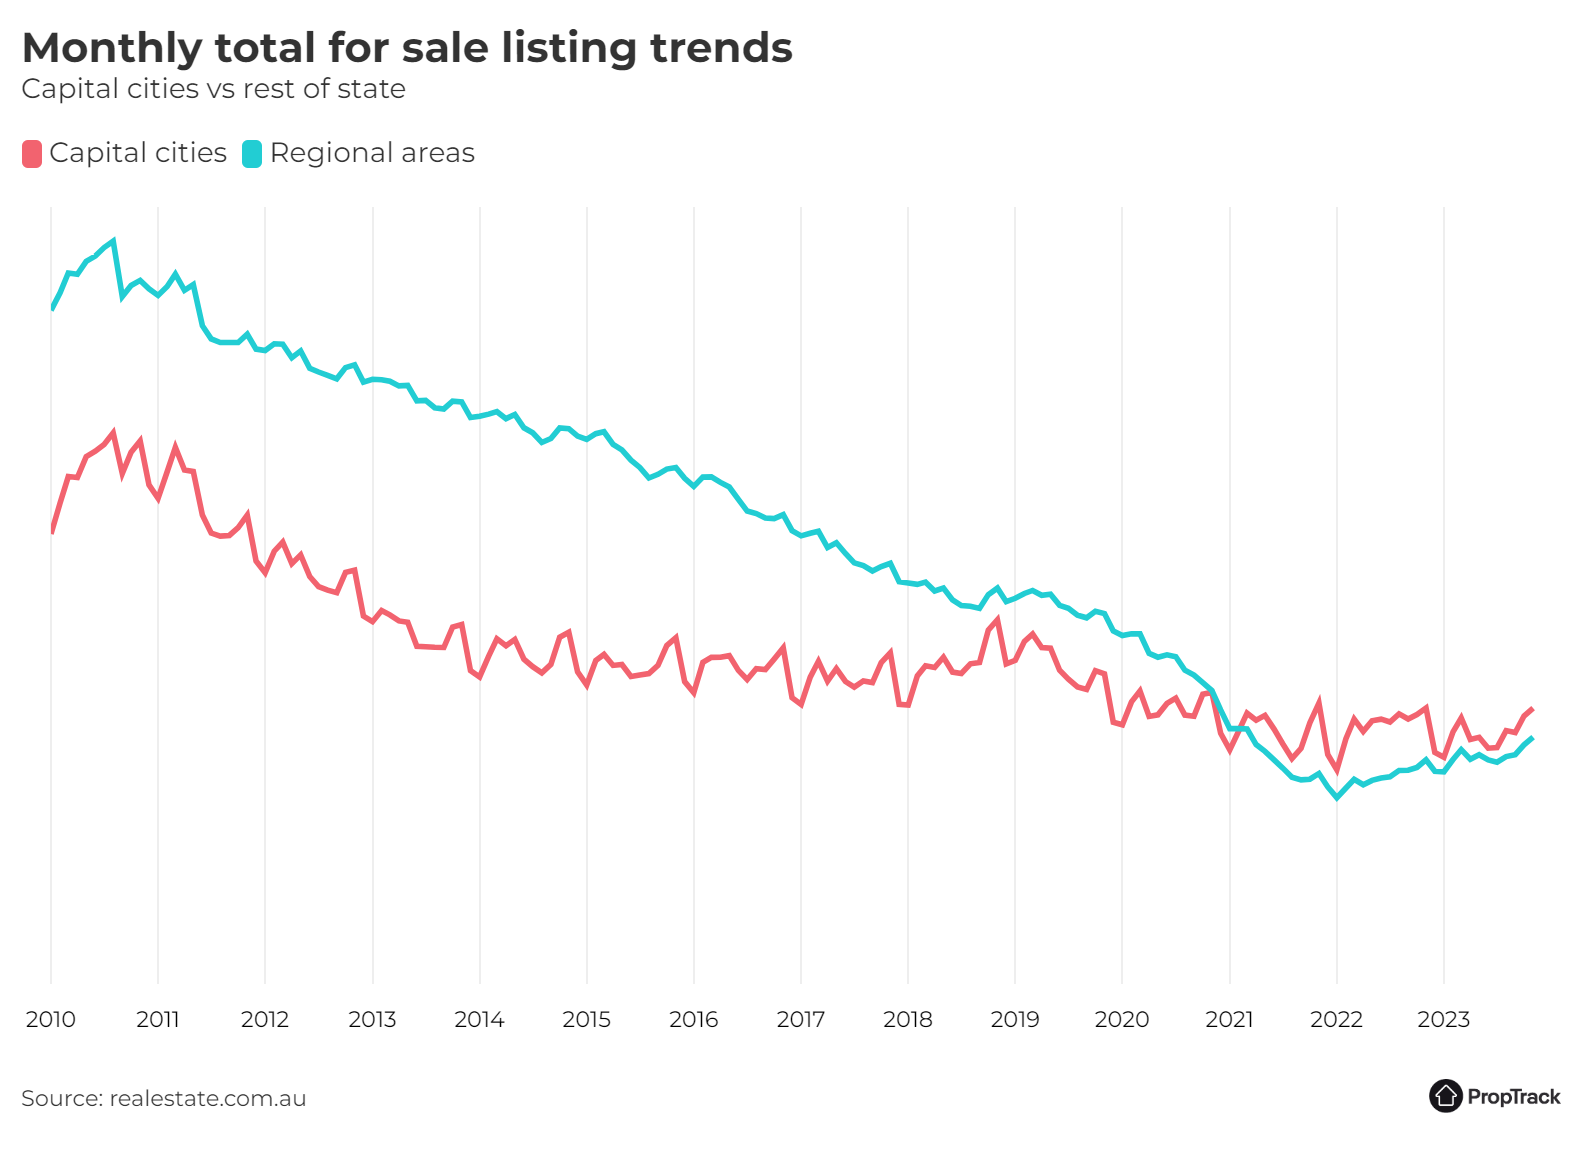
For buyers, choice remains quite healthy in Sydney, Melbourne, Canberra and Hobart. In all four cities, the total number of properties listed for sale is above the average over the past decade.
The same is not true in other capitals, though choice did improve for these buyers in November amid the busier conditions of the spring selling season. The total number of properties listed for sale in Brisbane, Adelaide and Perth is sitting around a third below where it was pre-pandemic.
Choice continued to improve regionally after a long period of very restricted options during the pandemic. The total number of properties listed for sale regionally increased 3.2% in November, and it now sits 10.1% higher than a year ago.
Buyers in some regional areas are faring better than others. Regional NSW and regional Victoria have seen solid improvements in choice over two years or so. In contrast, regional Queensland, SA and WA have around half as many properties listed for sale as they did prior to the pandemic.
Where to from here?
The spring selling season in Sydney and Melbourne this year has been much closer to what has been typical over the past decade, and busier than last year’s very quiet spring. That reflects improved selling conditions, more certainty about interest rates, and the fact that prices are growing, compared to declines last year. These factors have supported vendor confidence.
After raising interest rates in November, the RBA held steady in December as was widely anticipated. While there is a possibility of further interest rate increases, which could negatively affect buyer and seller sentiment, pricing for cash rate futures indicates that markets are now expecting no further increases, and that there is the possibility of declines next year.
Over the longer-term, tight rental markets, strong population growth, and growing wages will continue to support fundamental demand for property.
November capped off a busier spring for Sydney’s property market.
As is usually the case, November was a quieter month in Sydney’s property market following the peak of the spring selling season in October. However, activity remained much busier than last spring, with 11.9% more new listings than at the same time last year.
While November was a much busier month than at the same time last year, it was still a little slower than has been typical for the end of spring over the past decade or so.
The quieter month meant choice for buyers declined very slightly (down 0.8% month-on-month). Even so, choice for buyers in Sydney remains healthy, with the total number of properties listed for sale sitting more than 10% above the average over the past decade.
Regional NSW saw a slightly quieter month, with 1.1% fewer new listings than in October, though activity was still a little faster than a year ago (up 2.5% year-on-year). Choice for buyers continued to improve in November (up 4% month-on-month), bringing the total number of properties listed for sale across regional NSW 13% below where it stood pre-pandemic – its highest level since August 2020.
Victoria
Melbourne’s busier spring continued in November.
Melbourne’s busier spring continued in November, with new listings up a strong 19.1% year-on-year. Overall, this spring has seen activity more in line with what has been typical for spring over the past decade or so, after a very quiet spring last year.
New listings did decline a bit compared to October, as is typically the case, down 5.2% month-on-month. That decline is largely in line with the typical seasonal fall in activity after the peak of the spring selling season in October.
Buyers across Melbourne are enjoying healthy choice, and it improved further in November. The total number of properties listed for sale in November was up a further 3.5% month-on-month, and is now sitting more than 20% above its average over the past decade.
Regional property markets saw a similar story, with new listings coming off a little from their October peak (down 5.8% month-on-month), but still well up compared to a year earlier (13.4% year-on-year).
Queensland
Activity across Brisbane’s property market held up in November, but choice for buyers remains limited.
Brisbane’s property market largely maintained pace with its mid-spring peak, with just 0.4% fewer new listings in November than in October. That is a smaller fall than is typical for November, but not unusual – November has been busier than October in some years.
While activity largely kept pace with last month, it slipped a bit compared to 2022. As a result, new listings were down a modest 2.2% year-on-year.
In good news for buyers, choice continued to improve, with 3.5% more total listings in November than a month earlier. Even so, options remain fairly limited for buyers. The total number of properties listed for sale across Brisbane is 13.4% lower than a year ago, and is down a third compared to pre-pandemic.
Activity picked up in regional Queensland to end the spring selling season. Nonetheless, activity remains slower than a year ago, with new listings across regional Queensland 9% lower year-on-year.
South Australia
Activity across Adelaide’s property market picked up for its usual spring selling season peak.
Adelaide’s property market rounded out the spring selling season with activity increasing for what is typically the busiest month of the year. New listings increased 4.4% compared to October, bringing activity mostly in line with the pace seen last year.
The busy month of new properties hitting the market meant choice for buyers improved further, after a strong increase in October. The total number of properties listed for sale in November increased 8.4% compared to October. Nonetheless, choice for buyers remains restricted compared to what has been typical over the past decade.
Regional markets also saw activity pick up in November, with new listings up 10% month-on-month. That helped keep activity busier than a year ago, with new listings up 5.9% year-on-year.
Western Australia
New listings picked up in November to round out the spring selling season, but activity continued to lag the pace set last year
Perth saw activity pick up in the final month of the spring selling season, with new listings increasing 5.9% month-on-month in November.
Even so, activity continued to lag the pace set last year, as it has since spring 2022. New listings were down 7.7% year-on-year.
The slower pace of new supply hitting the market, and strong demand, means the total number of properties listed for sale across Perth continues to be very restricted. While it lifted a little in November compared to October, it is 24.4% lower than a year ago.
Regional WA saw a very slightly slower month, with 0.6% fewer new listings hitting the market than in October. That meant new listings were down 2.3% compared to a year ago.
Tasmania
New listings picked up across Hobart for what is typically Hobart’s busiest month of the year.
Hobart’s property market saw a slightly busier month to round out the spring selling season in November, with 8.1% more new listings than in October. That is consistent with the typical season pattern for Hobart, which, unlike nearly every other capital city, usually sees the spring peak in November rather than October.
Even so, the month was still a little slower than at the same time a year ago, with 2.4% fewer new listings year-on-year.
Choice continued to improve for buyers across Hobart and is now sitting at its highest level in more than six years. The total number of properties listed for sale across Hobart in November was 17.6% higher than a year ago, and was sitting close to 12% higher than the average over the past decade.
Regional Tasmania also saw activity lift, with 8.5% more new listings month-on-month. Unlike Hobart, that kept activity busier than a year ago (up 5.2% year-on-year).
Northern Territory
New listings slowed in November after the mid-spring peak.
Activity slowed across Darwin’s housing market after the usual mid-spring peak in October. New listings in November were 14.5% lower than in October, and unlike in October, also lagged behind the pace set in 2022 (down 9.9% year-on-year).
The quieter month of new properties meant choice for buyers declined a little compared to October. The total number of properties listed for sale across Darwin in November declined 3.3%, though it remained 4.8% higher than it was a year ago.
Regional NT also saw new listings fall in November, though they remain a little higher than a year ago. However, the regional NT market is small and can be quite volatile.
Australian Capital Territory
Activity in Canberra’s property market slowed after its busiest October on record, but remained busier than a year ago.
Activity in Canberra’s property market slowed down a little after its busiest October on record. November saw 7.4% fewer new listings than October. October is usually Canberra’s busiest month, so it is not unusual to see activity slow a little in November.
While activity didn’t keep pace with October, it was still busier than at the same time last year. New listings were up 13.3% year-on-year.
Choice for buyers in Canberra continues to be relatively good, with a further lift in November. The total number of properties listed for sale increased 7% compared to October, and is now sitting 24.2% higher than a year earlier. This means it is well above the average over the past decade.
Methodology
The ‘PropTrack Listings Report’ details monthly changes in the number of properties listed for sale on realestate.com.au. The listings are split into ‘new’ and ‘total’ listings.
New listings consist of properties that were newly listed for sale on realestate.com.au within the reported month.
Total listings is the total supply of properties for sale in the reported month. It consists of all listings which were for sale during that month (including new listings) irrespective of the date they first appeared on site.
The geographical areas described in this report are based on the Greater Capital City Statistical Area (GCCSA) as defined by the Australian Bureau of Statistics.
Disclaimer: PropTrack Listings Report is summary information only. realestate.com.au Pty Limited [REA] makes no representation whatsoever about PropTrack Listings Report’s completeness or accuracy. REA is under no obligation to update or correct any of the PropTrack Listings Report data or to continue to make the PropTrack Listings Report available. REA recommends that any users of the PropTrack Listings Report exercise their own skill and care with respect to their use of the PropTrack Listings Report and that users carefully evaluate the accuracy, currency, completeness and relevance of the PropTrack Listings Report for their purposes. REA expressly bears no responsibility, and accepts no liability, whatsoever for any reliance placed by you or others on the PropTrack Listings Report, or from any use of the PropTrack Listings Report by you or others. If you wish to cite or refer to this report (or any findings or data contained in it) in any publication, please refer to the report as the ‘PropTrack Listings Report – November 2023′.