Property listings jump in May, but 2023 remains quieter than 2022.
Activity in property markets bounced back across the country after the slower month in April, when public holidays affected property market activity. That said, May continued the trend of slower property market activity in 2023, relative to the pace seen in 2022. In part, that reflects just how busy property markets were during the start of 2022.
The good news for buyers is that the total number of properties available for sale has continued to improve compared to a year ago, and compared to the low levels seen during 2021. This is particularly true in regional NSW and regional Victoria, with the latter now seeing just 6% fewer properties available for sale in May than was the case pre-pandemic.
New listings jumped in May, but were lower than the same time last year. Picture: Sam Ruttyn
This monthly report analyses new and total listings on realestate.com.au to provide the most up-to-date view on property market supply trends.
Executive summary
Property market activity bounced back in May after a quieter, public-holiday-affected April. Even so, activity remains more subdued than last year’s busy pace, continuing 2023’s trend of slower listings activity.
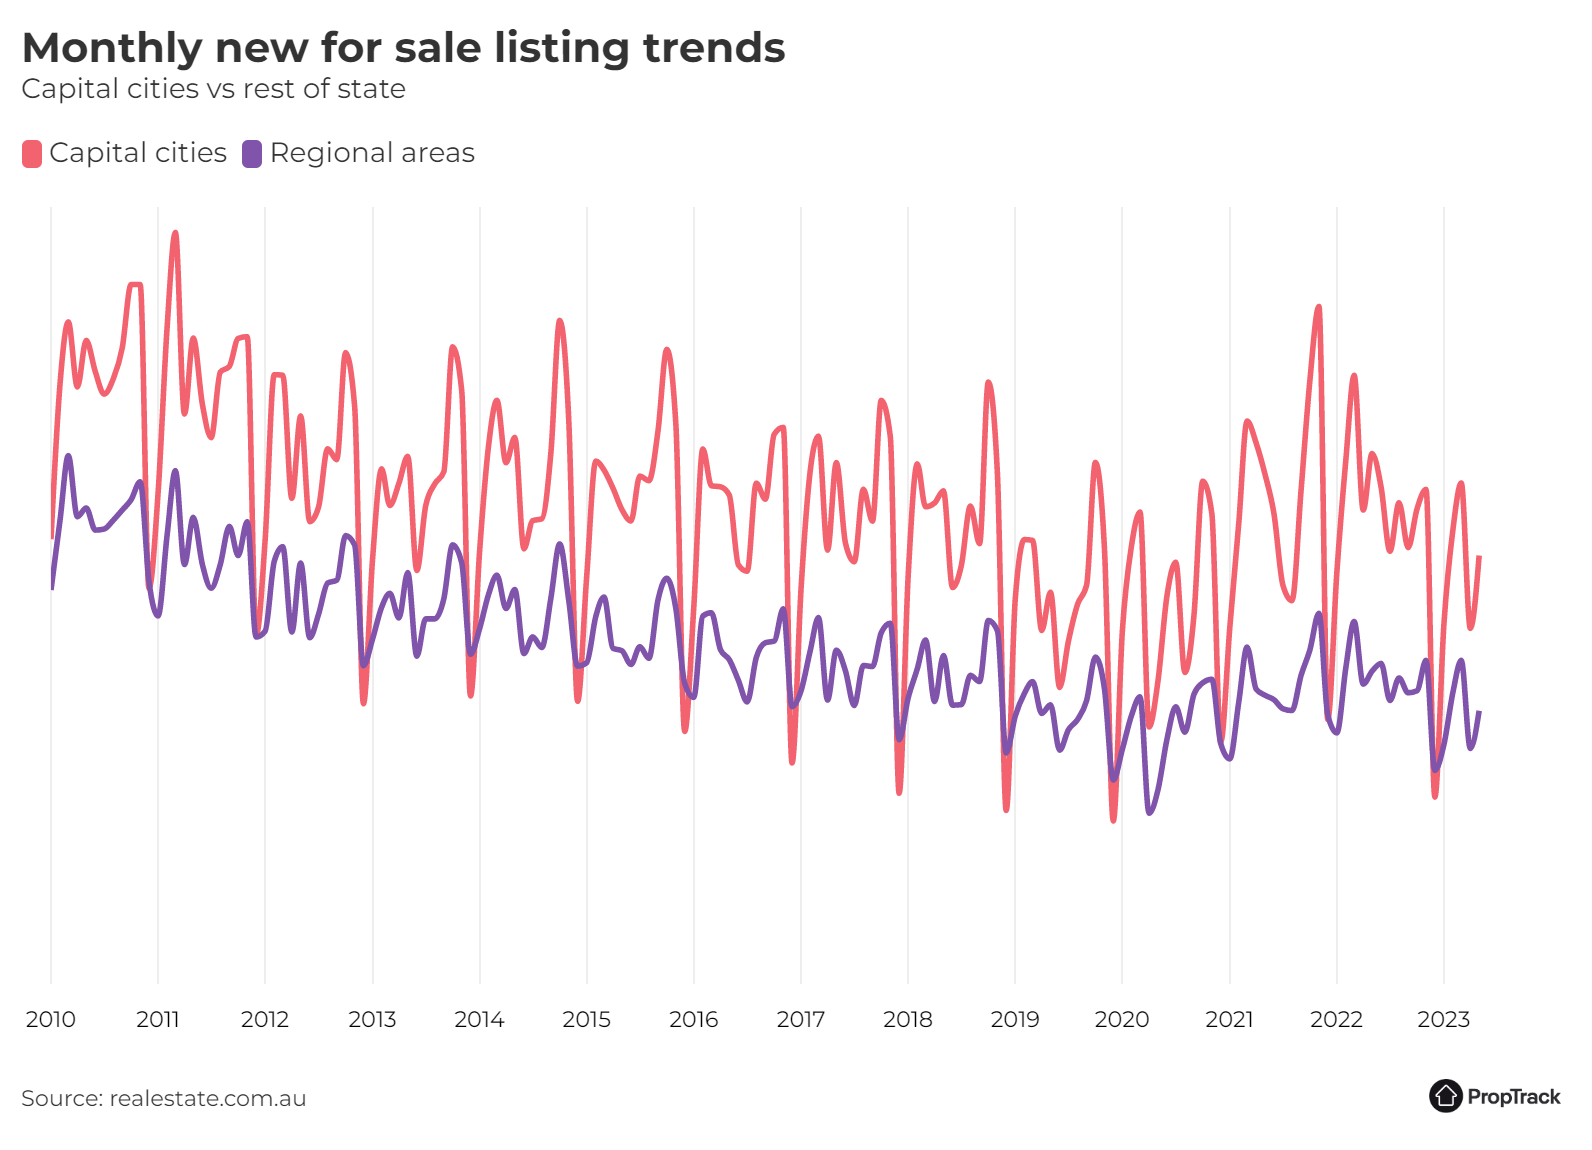
Nationally, new listings on realestate.com.au increased 18.7% month-on-month compared to April. But compared to last year, new listings were down 16.8% in May. That year-on-year decline is a little smaller than was seen in April, but is broadly consistent with the pace in March.
The story was similar across the capital cities, with all seeing new listings bounce back from April, but none keeping pace with last year. Across the capital cities, new listings were up 20.5% month-on-month, but were down 19.2% compared to May last year. While a notable year-on-year decline, it in part reflects the busy pace of activity property markets were maintaining in the first half of 2022 before activity began to slow in winter.
Both Sydney and Melbourne recorded fewer new listings this May compared to last year (down 17.5% and 19% respectively). Hobart continued to be one of the more-active capital city property markets, but even so, new listings were down 6.6% compared to last year.
Regional areas also saw new listings bounce back in May, up 16.1% month-on-month. As with capital cities, market activity in regional areas in 2023 has not kept pace with conditions in 2022, though the slowdown has not been as large as in capital cities. New listings regionally were down 12.6% year-on-year in May.
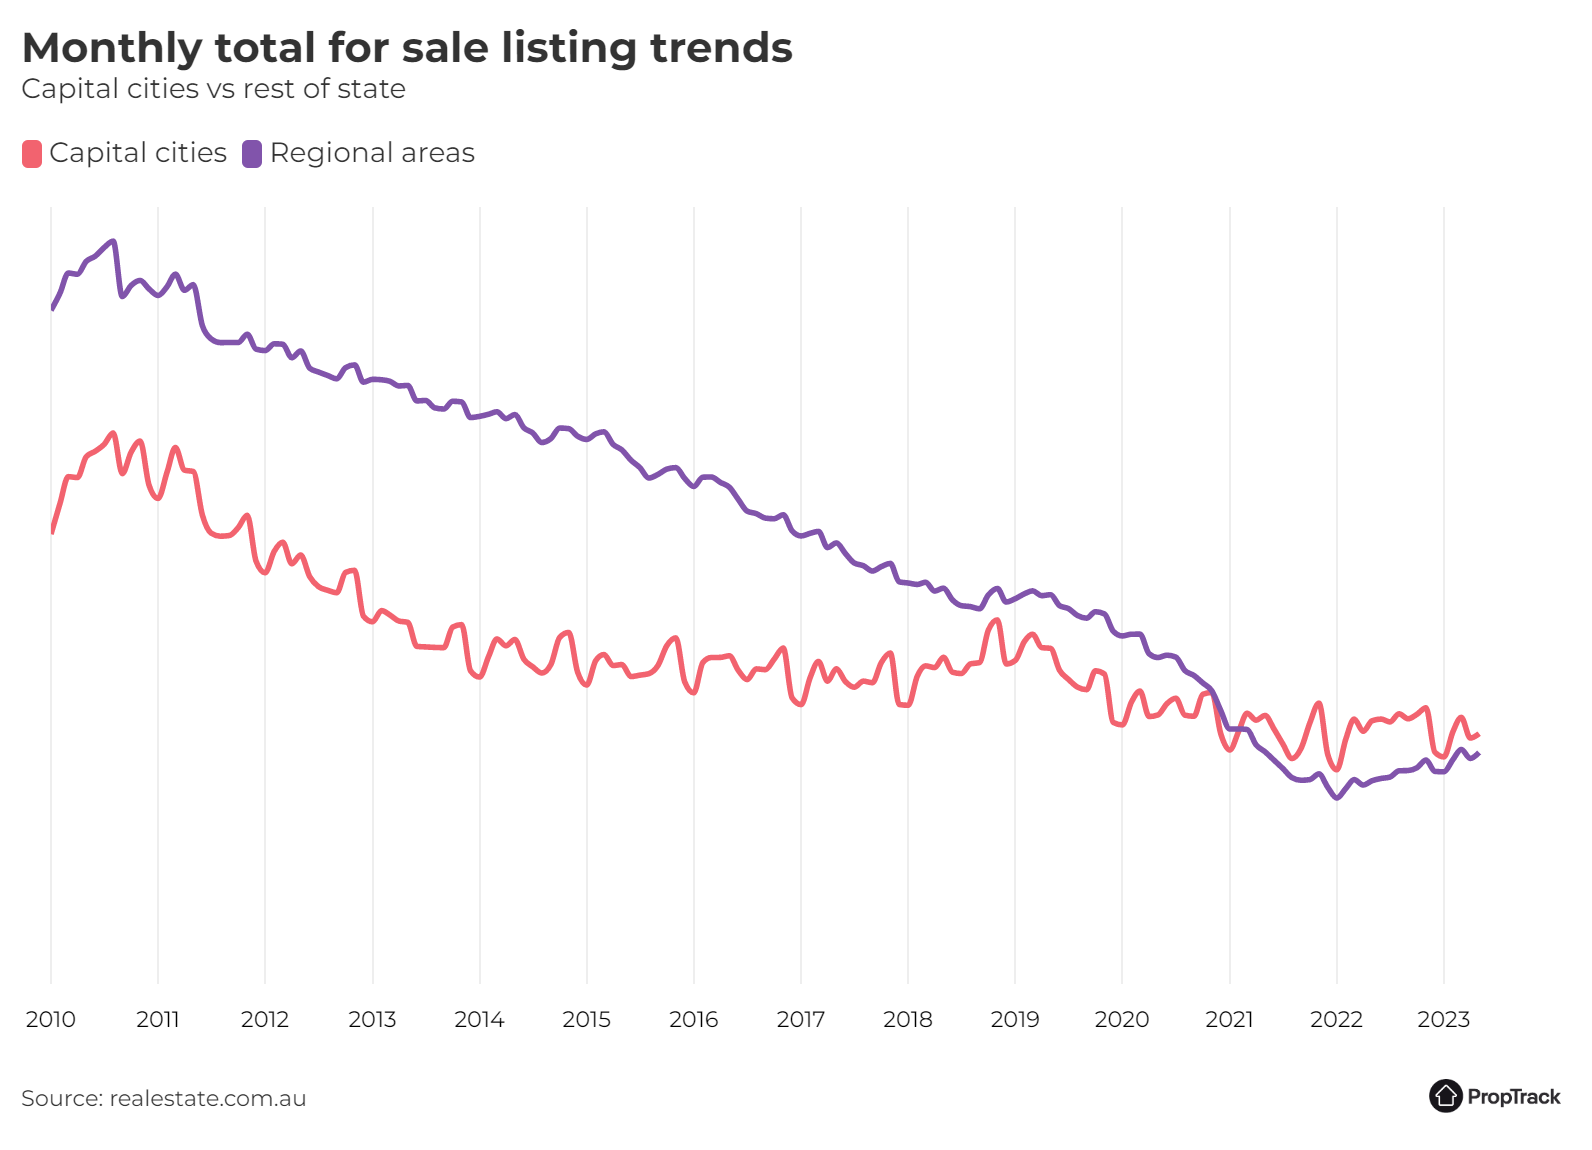
Buyers enjoyed a modest improvement in choice in May compared to April, with an increase in the total number of properties listed on realestate.com.au. That continues the broad, albeit slow, trend of increased choice we’ve seen over much of the past 12 months. That improvement helped lift the total number of properties available for sale up about 3.3% compared to a year ago, bringing it around 10% higher than what was typical in the latter half of 2021.
The increase in total listings has been particularly sharp in regional Victoria and regional NSW. Both regions saw substantially more properties listed for sale in May than they did a year ago, which is providing buyers with more choice after a period of severely limited options during the pandemic. The change is particularly notable in regional Victoria, where total listings in May were just 6% below pre-pandemic levels.
Buyers in Sydney and Melbourne are faced with a bit less choice this year than they had last year, with less total properties available for sale in May than a year ago. This is in part due to fewer new listings hitting the market this year, but it also shows choice for buyers was quite plentiful last year, making this year look softer by comparison. Looking over a longer timeframe, choice for buyers in Sydney and Melbourne remains solid, with the total number of properties available for sale only a little below the prior-decade average in Sydney, and above the prior-decade average in Melbourne. The same is not true in Brisbane, Adelaide, and Perth – all of which are seeing far fewer properties available for sale than has been typical over the previous decade.
Where to from here?
Property markets have had a quieter start to the year than was the case in 2022. That slowdown comes after a busy period in early 2022. With the autumn selling season now behind us, market activity is likely to be a little slower over the next few months during the typically quieter winter period, before picking up again for spring.
Home prices increased in May for the fifth consecutive month. While the increases have been modest, they have been consistent, and it is a change from the price falls seen throughout much of 2022 when the RBA was raising interest rates rapidly.
While selling conditions are softer than a year ago, and market activity has slowed, market conditions have improved from late 2022. Auction clearance rates have remained reasonably firm through autumn and have picked up noticeably compared to the second half of 2022.
Further out, the fundamentals of housing demand remain strong. Unemployment has remained close to multi-decade lows for much of 2022 and into 2023. Wages growth, while running slower than inflation, has started to pick up, and there are signs inflation is starting to subside. International migration has also resumed, which will further add to housing demand, and rental markets are extremely tight across the country.
How listings are faring across Australia
New South Wales
Activity in Sydney’s property market picked up in May after the usually quieter month of April.
Property market activity in Sydney rebounded in May, as is usually the case coming off the quieter, public-holiday-affected month of April. Even so, market activity remained quieter than a year ago, as it has throughout 2023. New listings were down 17.5% year-on-year in May - a slightly slower pace of decline compared to March and April.
While the busier month of new properties hitting market helped improve choice for buyers compared to April, options have tightened compared to a year ago. The total number of properties listed for sale across Sydney was 11% lower in May than it was a year ago. That said, it remains broadly in line with historic averages, sitting around 3% below the average over the past decade.
Like Sydney, regional NSW saw property market activity return in May, but conditions remain slower than last year, with new listings down 13.3% year-on-year.
The good news for regional buyers is that there has been a marked improvement in choice over the past 18 months after the extremely restricted conditions experienced during the pandemic. Compared to a year ago, the total number of properties available for sale in regional NSW was up 29.7%, and is up more than 60% from its lowest level.
Victoria
Melbourne’s property market bounced back after the April long weekends, but activity remains slower than last year.
As is usually the case, activity picked back up in Melbourne’s property market in May, after the Easter and Anzac Day long weekends in April. Even so, activity in 2023 has been slower than the pace seen in 2022, with fewer new listings across Melbourne this year than last.
New listings were up 17.4% month-on-month in May after the public holidays in April but were still 19% lower year-on-year, broadly consistent with the pace of year-on-year declines seen across the past few months.
The busier month helped improve choice for buyers in Melbourne, with the total number of properties listed for sale increasing 1.4%. Buyers in Melbourne have been enjoying reasonable choice in 2023, with the total number of properties listed for sale slightly above the average over the past decade, and only marginally below where it was last year (down 1.4% year-on-year).
Property markets in regional Victoria also bounced back, but May was still a little slower than last year (down 5.5% year-on-year).
The good news for regional buyers is that choice is improving, and there has been a large increase in the total number of properties listed for sale over the past year or so. The total number of properties listed for sale in March was up 41.7% compared to a year ago and is now just 6% below its pre-pandemic level.
Queensland
Brisbane’s property market had a busier month in May after the quieter, long-weekend-affected month of April.
May saw activity in Brisbane’s property market pick back up after subdued activity in April. New listings were up 22.1% month-on-month in May.
As has been the case throughout 2023, activity in Brisbane’s property market was slower than it was last year. New listings were down 21.3% year-on-year in May.
Choice for buyers improved modestly in May, but the pick-up wasn’t enough to match last year. As a result, the total number of properties listed for sale in May was down slightly (-2%) compared to a year ago.
Regional Queensland also saw activity return after the public holidays, but, as with Brisbane, activity in 2023 has not kept pace with the busy market conditions in 2022.
Unfortunately for buyers, choice in regional Queensland remains restricted, though it improved marginally in May (+2.1% month-on-month). Despite the increase in the month, the total stock of properties listed for sale was lower than it was a year ago, and around 45% below pre-pandemic levels.
South Australia
Property market activity bounced back across Adelaide after the long weekends in April, but conditions remain slower than last year.
New listings bounced back in May after the typically slower month in April. Even so, Adelaide’s property market has been quieter than in 2022. There were fewer new listings this year than last, down 19.7% year-on-year, a broadly similar pace of decline as in April.
Choice for buyers increased slightly in Adelaide, continuing the trend of modest improvements in choice for buyers in 2023. Even so, the improvements this year have not been large, and the pandemic saw substantial declines in the total number of properties listed for sale. As a result, the total number of properties listed for sale in May was still around a third lower than it was pre-pandemic.
The story was similar in regional markets, with market activity picking back up after April, but not keeping pace with last year. Regional SA saw 9.2% fewer new listings in May this year compared to last year.
Choice for buyers remains extremely limited in regional SA, down by about 60% compared to pre-pandemic levels. But there are some early encouraging signs that conditions are starting to improve: May 2023 was the first time the total number of properties listed for sale in regional SA was higher than a year ago since the pandemic.
Western Australia
Buyers in Perth are facing extremely limited choice, with the total number of properties listed for sale only slightly above record lows.
Activity in Perth’s property market picked back up in May, as is typically the case after April. Even so, activity has slowed compared to a year ago, with fewer new properties hitting the market this May compared to last. New listings were up 19.5% month-on-month compared to April, but were down 23.4% year-on-year.
Options remain extremely limited for buyers in Perth, with the total number of properties listed for sale near historic lows. Compared to a year ago, the total number of properties listed for sale is 13.6% lower, and the small increase in May compared to April (+0.7% month-on-month) was not enough to unwind the decline between March and April.
The story was similar in regional WA, with activity picking up from April, but not keeping pace with last year. New listings in regional WA were down 21.8% compared to a year ago.
Tasmania
While activity picked up in May after the public holidays, momentum in Hobart’s property market appears to be slowing after a busy start to 2023.
While activity bounced back in Hobart’s property market after the quieter month in April, it has slowed compared to a year ago, and momentum in market activity appears to be fading after an initially busy start to 2023. New listings in May were up 27% compared to April, but were 6.6% lower year-on-year.
New listings also picked up in regional Tasmania after the public holidays, up 9.5% month-on-month.
While momentum does seem to be fading in Hobart’s property market, the busy past 12-18 months of new properties hitting the market means buyers in Hobart are faced with substantially more choice than was the case throughout much of the pandemic. In May, the total number of properties listed for sale in Hobart was still 57.8% higher than a year ago. This means the total number of properties available for sale is around its highest level since early 2017.
Northern Territory
New listings picked back up in May in Darwin’s property market, but activity remains slower than last year.
Activity in Darwin’s housing market picked back up in May after a slower public-holiday-affected April, with new listings up 25% month-on-month.
Choice for buyers improved in May, after declining in April amid the quieter month, continuing the trend of improving choice for buyers in Darwin. Compared to a year ago, the total number of properties listed for sale in May was up 5%, helping to lift it slightly above where it was pre-pandemic.
New listings were up a little in regional NT and, like in recent months, were higher than at the same time last year (+21.1% year-on-year). However, listings activity in regional NT can be volatile as it is a small market with relatively little activity each month.
Australian Capital Territory
Activity rebounded in Canberra’s property market in May after the public holidays in April
May saw new listings rebound in Canberra’s property market after subdued activity in April due to the public holidays (up 20.7% month-on-month). Activity in May was not as strong as a year ago, however, the year on-year decline in listings was smaller than has been typical in recent months (down 8.4% year-on-year in May).
Buyers in Canberra continued to enjoy more choice than has been typical over the past decade, with the total number of properties listed for sale in May up a little over 10% compared to the prior decade average. The total number of properties available for sale was up in May compared to April, up 3.3% month-on-month.
Methodology
The ‘PropTrack Listings Report’ details monthly changes in the number of properties listed for sale on realestate.com.au. The listings are split into ‘new’ and ‘total’ listings.
New listings consist of properties that were newly listed for sale on realestate.com.au within the reported month.
Total listings is the total supply of properties for sale in the reported month. It consists of all listings which were for sale during that month (including new listings) irrespective of the date they first appeared on site.
The geographical areas described in this report are based on the Greater Capital City Statistical Area (GCCSA) as defined by the Australian Bureau of Statistics.
Disclaimer: PropTrack Listings Report is summary information only. realestate.com.au Pty Limited [REA] makes no representation whatsoever about PropTrack Listings Report’s completeness or accuracy. REA is under no obligation to update or correct any of the PropTrack Listings Report data or to continue to make the PropTrack Listings Report available. REA recommends that any users of the PropTrack Listings Report exercise their own skill and care with respect to their use of the PropTrack Listings Report and that users carefully evaluate the accuracy, currency, completeness and relevance of the PropTrack Listings Report for their purposes. REA expressly bears no responsibility, and accepts no liability, whatsoever for any reliance placed by you or others on the PropTrack Listings Report, or from any use of the PropTrack Listings Report by you or others. If you wish to cite or refer to this report (or any findings or data contained in it) in any publication, please refer to the report as the ‘PropTrack Listings Report – May2023′.