Australia’s biggest property markets are warming ahead of spring, with both Sydney and Melbourne busier than usual for July.
While national property market activity was a little quieter in July, Sydney and Melbourne bucked the trend with more new listings hitting the mid-winter market than has been typical over the past decade.
That meant there was positive year-on-year growth in new listings in both cities for the first time since spring 2022. In most other capitals and regional areas activity remained slower than last year.
Buyers had slightly more choice in July, with the total number of properties available for sale across the country edging up 0.4% compared to June, though the market overall remains a bit tighter than a year ago. For buyers in Sydney, Melbourne, Canberra and Hobart, the total number of properties listed for sale is reasonably high, sitting at, or within 10%, of the average over the prior decade. In other capitals, choice remains tighter. This is particularly true in Perth, where the total number of properties hit a fresh record low in July.
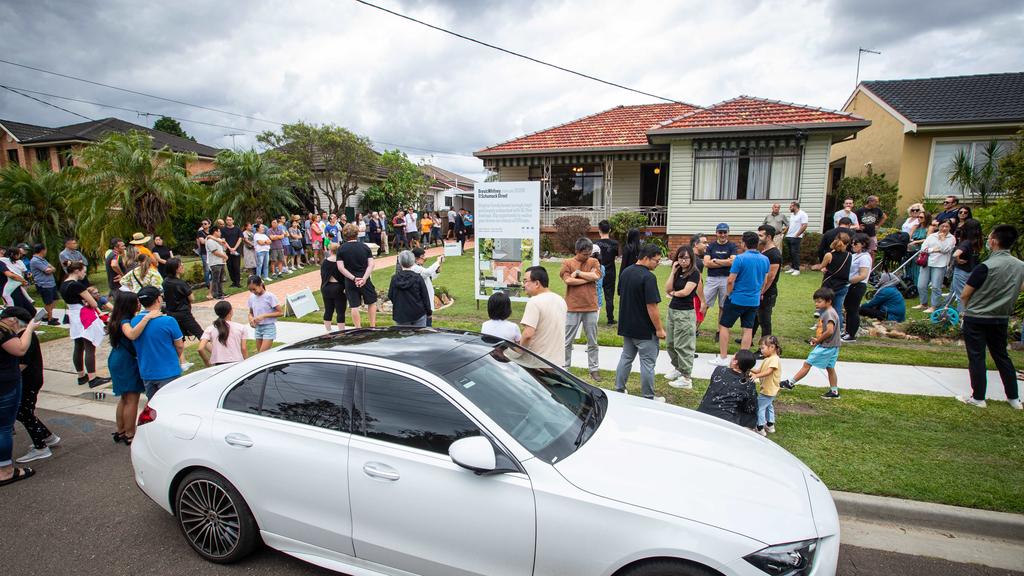
More new listings hit the market in Sydney and Melbourne than is typical in July. Picture: Julian Andrews
This monthly report analyses new and total listings on realestate.com.au to provide the most up-to-date view on property market supply trends.
Executive summary
The underlying pace of property market activity started to pick up in Sydney and Melbourne after a slower past year, while other capitals and regional areas continued their quieter 2023.
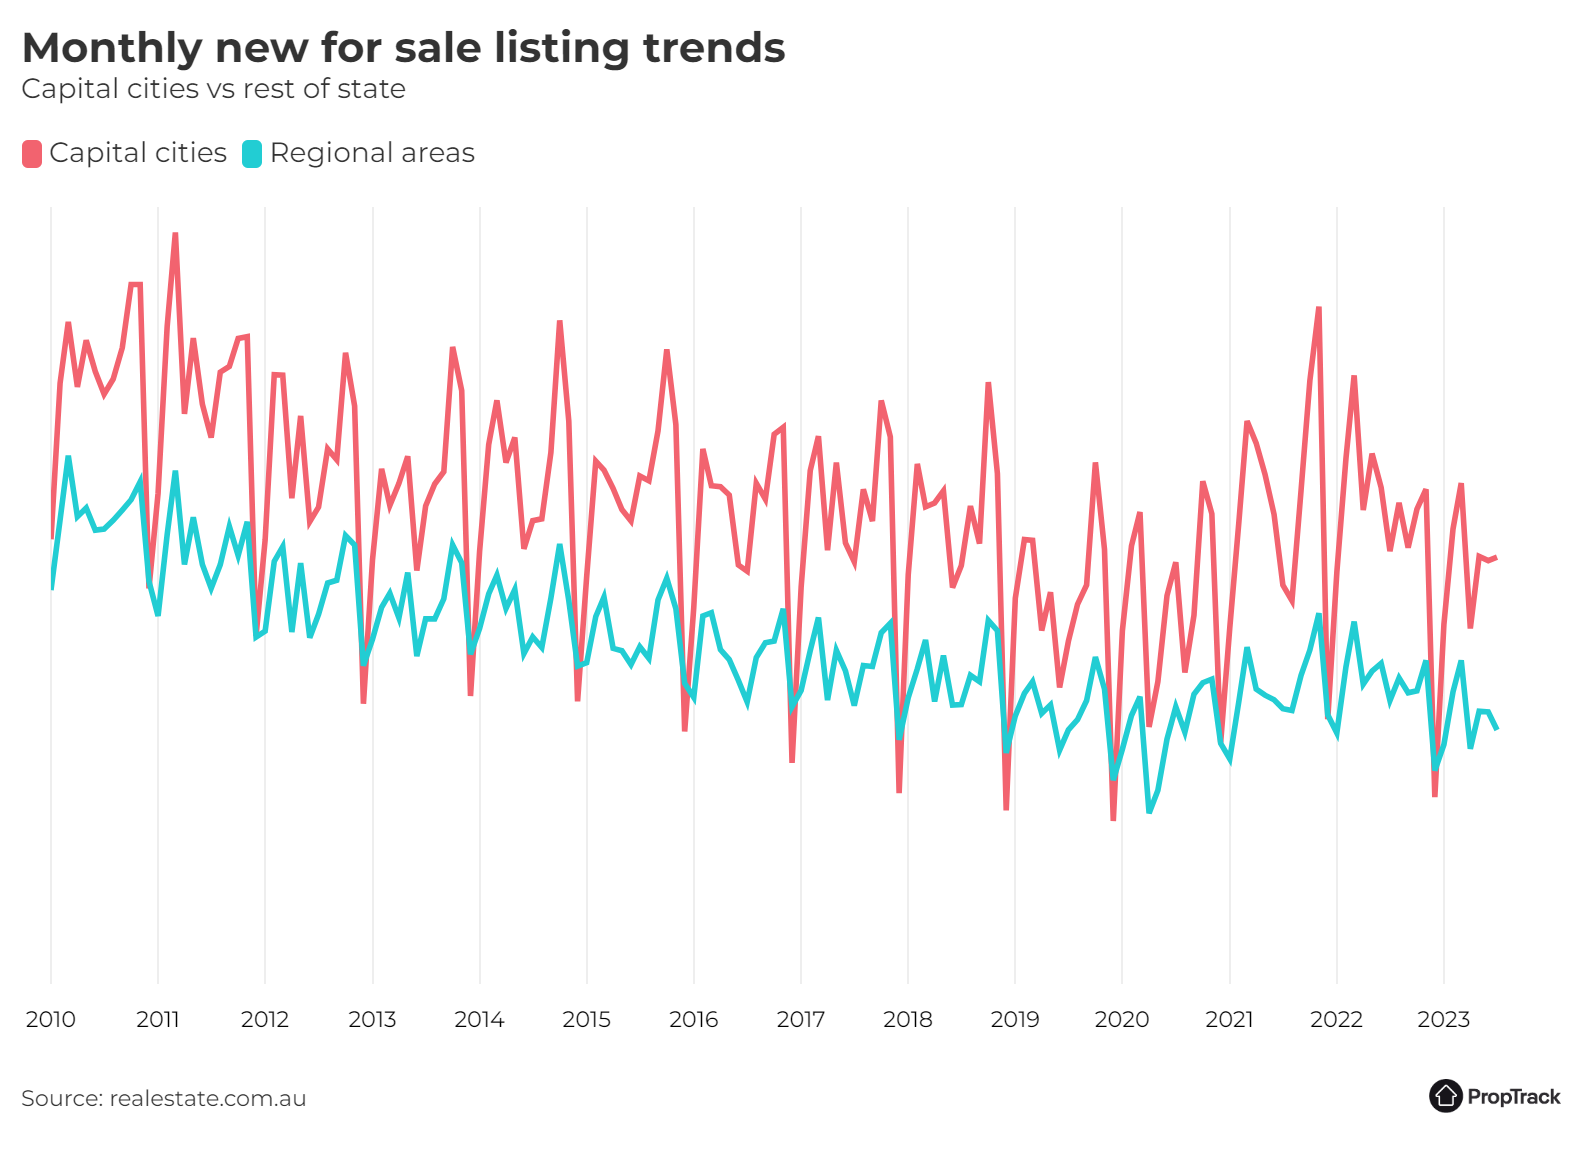
Nationally, new listings on realestate.com.au declined slightly in July compared to June, down 2.1% month-on-month amid the usually quiet winter period. Nationally, there were fewer new listings this year than last (-4.9%), as was the case throughout late 2022 and the first half of 2023.
In aggregate across the capital cities, new listings remained lower than a year ago (down 1.4% year-on-year). However, that aggregate masks differences across the capitals.
Sydney and Melbourne both recorded more new listings this year than last year, the first time either city has recorded positive year-on-year growth in new listings since spring 2022. New listings in Sydney were 9.2% higher year-on-year; in Melbourne they were 9.1% higher year-on-year. While part of the reason for that growth is that last July was a slower month for both cities, it is not the whole story. There were more new listings in both cities in July than has been typical on average for this time of year over the past decade.
In contrast, most other capitals had fewer new listings this year than last, with Darwin (-17.6% year-on-year), Perth (-16.6% year-on-year) and Brisbane (-14% year-on-year) leading the declines.
Regional areas had fewer new listings in July compared to June, pushing them 10.4% lower year-on-year.
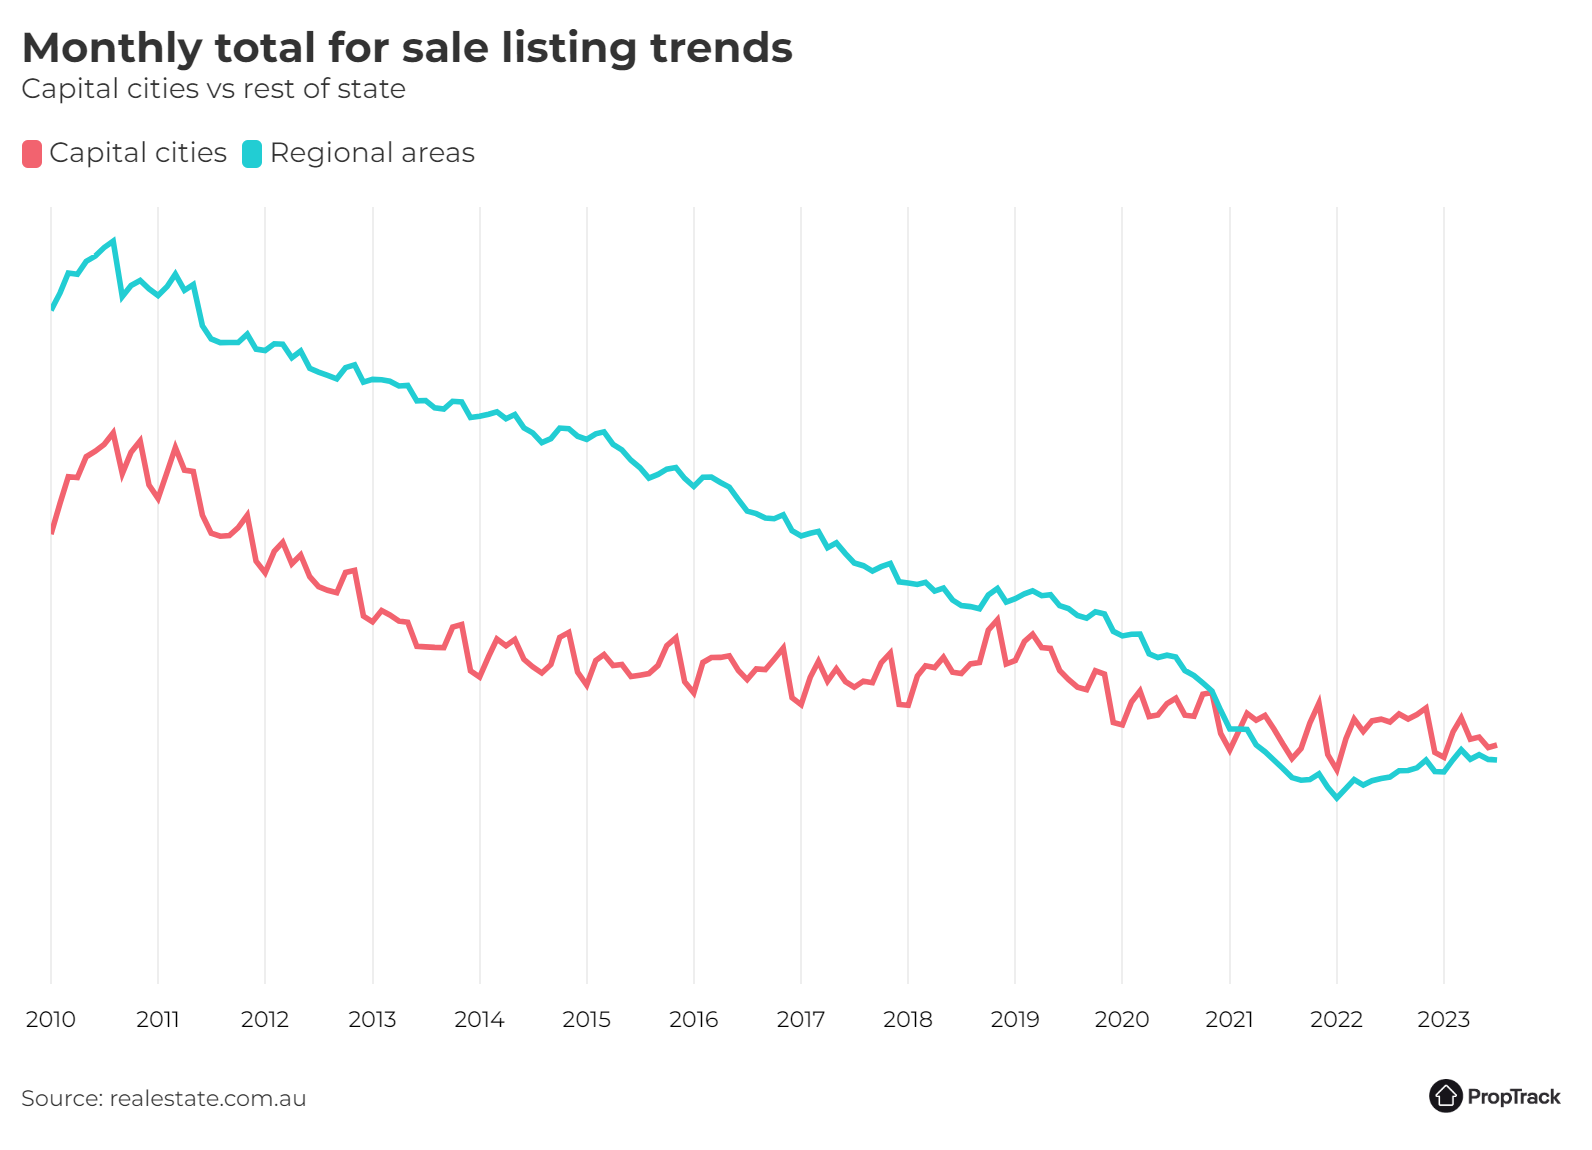
The total number of properties listed for sale across Australia was largely unchanged in July, increasing a modest 0.4% month-on-month. That kept choice for buyers marginally tighter than a year ago, with the total number of properties listed for sale in July down 1.3% year-on-year.
Buyers across the capital cities are facing quite different conditions. In Melbourne, and to a lesser extent Sydney, the total number of properties available for sale is reasonably high, albeit down from a year ago in Sydney. The total number of properties available for sale is above decade-average in Melbourne and Canberra, and only modestly below average in Sydney (down about 4%).
The same is not true for buyers in Brisbane, Adelaide and especially Perth. Buyers in Perth have particularly restricted options, with the total number of properties listed for sale at a fresh record low in July. In both Brisbane and Adelaide, the total number of properties listed for sale is down compared to a year ago, and about 40% below its prior-decade average.
Buyers searching in regional Victoria and regional NSW have seen substantial improvements in choice over the past 18 months after a period of incredibly limited options during the pandemic.
Where to from here?
After a quieter first half of 2023, property market activity is showing early signs of picking up in Sydney and Melbourne amid what is typically the quieter winter season. Activity is likely to continue increasing over the next few months heading into the spring selling season for the usual seasonal peak of activity in October and November.
Selling conditions and home prices have picked up compared to the second half of 2022. Home prices nationally posted the seventh consecutive month of growth in July, and have recovered 2.8% since December. That means home prices nationally are now sitting just 1.4% below the March 2022 peak.
The Reserve Bank held the cash rate at 4.1% for the second consecutive month in July, and a stabilisation in interest rates looks to be within sight. Inflation appears to be heading back towards target at a pace consistent with what the RBA was expecting. As a result, markets are factoring in only a modest chance of further increases in interest rates.
Further out, the fundamentals of housing demand remain strong. Unemployment remains extremely low by historic standards and has shown little sign of moving higher. Rental markets are extremely tight across much of the country amid strong demand and limited rental availability. International migration has also resumed, which will further add to housing demand.
How listings are faring across Australia
New South Wales
Activity in Sydney’s property market picked up modestly in July to record the first year-on-year increase in new listings since August 2022.
Property market activity showed signs of picking up in Sydney after a quiet 12 months. New listings in July were higher than a year ago for the first time since August last year, up 9.2% year-on-year. While July is a seasonally quieter month, July this year was a little busier than has been typical over the past decade.
New listings also increased compared to June, up 2.3% month-on-month.
Choice for buyers increased in July after declining slightly in June. The total number of properties listed for sale across Sydney increased 2.6% month-on-month, though total listings remain 11.6% lower than a year ago. While this is a substantial year-on-year decline, it in part reflects the fairly abundant choice available to buyers a year ago. Even with that decline, the total number of properties listed for sale across Sydney is only about 4% below the average over the past decade.
Regional NSW saw a small decline in property market activity in July. New listings were down 3.8% month-on-month in July, and were 5.8% lower than at the same time last year.
The good news for regional buyers is that there has been a marked improvement in choice over the past 18 months or so after a period of extremely restricted options during the pandemic. Compared to a year ago, the total number of properties available for sale in regional NSW was up 19% in July, and up more than 50% since the start of 2022. Even so, it remains about a quarter below its pre-pandemic level.
Victoria
Melbourne’s property market showed early signs that activity might be picking up, with the first year-on-year increase in new listings since August last year.
Activity in Melbourne’s market increased after a fairly quiet 12 months, with new listings in July up 5.3% compared to June.
That pick up helped lift activity in Melbourne’s property market to be higher than a year ago for the first time in nearly a year. New listings in July were 9.1% higher than a year ago.
While that, in part, reflects that July 2022 was a quieter month, July this year was busier than has been typical for mid-winter in recent years. The number of new listings in July was about 10% higher than a typical July over the past decade.
More properties hitting the market helped lift choice for buyers in Melbourne, with the total number of properties listed for sale increasing 2.7% month-on-month in July. That brought the total number of listings broadly back in line with where it was a year ago (+0.7% year-on-year), and in line with the average over the past decade.
Property markets in regional Victoria had a slightly quieter July, with new listings down 0.3% compared to June to be largely in line with a year ago (down 0.1% year-on-year).
The good news for regional buyers is that choice continued to improve in July, cementing the gains seen over the past 12-18 months. The total number of properties listed for sale in July was up 38.2% compared to a year ago, and is now just 7% below its pre-pandemic level.
Queensland
Brisbane’s property market continued its quieter pace of activity in July, with a modest decline in new listings compared to June.
Activity declined slightly in Brisbane’s property market in July, with 2.9% fewer new listings hitting market than in June. That continued the trend of slower market activity seen across Brisbane in 2023 compared to last year, with 14% fewer new listings this July compared to the same time last year.
Despite the slightly slower month for new listings, choice for buyers improved modestly in July, with the total number of properties listed for sale on realestate.com.au increasing 2.1% month-on-month. However, the pick-up wasn’t enough to match last year, remaining 12.5% lower compared to a year ago.
Choice for buyers remains very limited. The total number of properties listed for sale across Brisbane is about 40% lower than what has been typical over the past decade.
Regional Queensland also saw activity decline in July, with 11% fewer new listings than in June, and activity not keeping pace with last year (-16.2% year-on-year).
As has been the case for some time, choice for regional buyers remains limited and declined a little further in July (-0.7% month-on-month).
South Australia
Property market activity declined a little in July for what is typically the quietest month of winter in Adelaide’s property market.
July saw a slightly quieter month across Adelaide’s property market, with new listings down a modest 1.2% compared to June. That is consistent with the seasonal lull as July is usually the quietest month of winter for Adelaide’s property market. As has been the case throughout 2023, activity has not kept pace with last year’s market. New listings were down 12.1% year-on-year.
The unfortunate news for buyers in Adelaide is that the total number of properties listed for sale declined 1.6% in July amid the slower flow of new properties hitting the market. That represents the second month of declining choice after some improvements earlier in the year.
The decline in July meant the total number of properties available for sale was 6.9% below its level a year ago, and about 40% lower than what has been typical over the past decade.
Regional markets also saw a slightly slower month, with 6.1% fewer new listings in July than in June.
Choice for buyers remains limited in regional SA and declined a little further in July, down 3% compared to June.
Western Australia
Choice continues to be extremely restricted for buyers in Perth, with the total number of properties listed for sale hitting a fresh record low.
Activity in Perth’s property market slowed further in July for what is typically Perth’s quietest winter month. New listings declined 5% month-on-month in July to be 16.6% lower than at the same time a year ago.
The slower month of new listings hitting the market compounded the limited options buyers are facing across Perth. The total number of properties listed for sale in Perth declined to a fresh historic low in July, falling 3.8% compared to June. That means the total number of properties listed for sale across Perth was down 24% compared to a year ago.
Regional WA had a similarly quiet month, with 9.9% fewer new listings in July compared to June. Like Perth, activity this year has not kept pace with last year, with new listings in regional WA down 20.5% compared to a year ago.
Tasmania
Hobart’s property market had a slightly busier July after a quiet June.
Hobart’s property market partly reversed the decline in activity seen in June, with 12.4% more new listings in July than in June. That brought activity largely in line with a year ago, with just 0.5% more new listings in July than at the same time last year.
New listings activity slowed in regional Tasmania, with new listings down 15.6% month-on-month in July.
While activity in Hobart’s property market has slowed from the pace set through 2022, that busy period of new properties hitting the market means there is still a substantially higher number of properties on the market than there was throughout much of the pandemic when choice was extremely limited. In July, the total number of properties listed for sale in Hobart was 37.9% higher than a year ago, though it was down 3.2% compared to June.
Northern Territory
Darwin’s property market had a quiet July, with a notable decline in new listings compared to a year ago.
Darwin’s housing market had a quiet month in July, with 21.7% fewer new listings than in June and 17.6% fewer than at the same time last year.
Even with the slower month, choice for buyers in Darwin improved slightly, with the total number of properties listed for sale increasing 0.4% compared to June. That continued the trend of improving choice for buyers in Darwin and means that the total number of properties listed for sale across Darwin is 4.5% higher than a year ago.
New listings also declined notably in regional NT but were still quite a bit higher than at the same time last year (+31.4% year-on-year). However, listings activity in regional NT can be volatile as it is a small market with relatively little activity each month.
Australian Capital Territory
Activity in Canberra’s property market declined modestly in July.
New listings in Canberra declined a modest 3.6% month-on-month in July amid the slower winter conditions. As has been the case for much of 2023, activity in July was not as busy as a year ago, with new listings 5.7% lower than at the same time last year.
The slower month of new listings meant the total number of properties listed for sale in Canberra declined a little compared to June, down 2.3% month-on-month. Even so, buyers in Canberra continued to enjoy more choice than has been typical over the past decade.
Methodology
The ‘PropTrack Listings Report’ details monthly changes in the number of properties listed for sale on realestate.com.au. The listings are split into ‘new’ and ‘total’ listings.
New listings consist of properties that were newly listed for sale on realestate.com.au within the reported month.
Total listings is the total supply of properties for sale in the reported month. It consists of all listings which were for sale during that month (including new listings) irrespective of the date they first appeared on site.
The geographical areas described in this report are based on the Greater Capital City Statistical Area (GCCSA) as defined by the Australian Bureau of Statistics.
Disclaimer: PropTrack Listings Report is summary information only. realestate.com.au Pty Limited [REA] makes no representation whatsoever about PropTrack Listings Report’s completeness or accuracy. REA is under no obligation to update or correct any of the PropTrack Listings Report data or to continue to make the PropTrack Listings Report available. REA recommends that any users of the PropTrack Listings Report exercise their own skill and care with respect to their use of the PropTrack Listings Report and that users carefully evaluate the accuracy, currency, completeness and relevance of the PropTrack Listings Report for their purposes. REA expressly bears no responsibility, and accepts no liability, whatsoever for any reliance placed by you or others on the PropTrack Listings Report, or from any use of the PropTrack Listings Report by you or others. If you wish to cite or refer to this report (or any findings or data contained in it) in any publication, please refer to the report as the ‘PropTrack Listings Report – July 2023′.