PropTrack Listings Report - April 2023


Angus Moore
Angus Moore

April was a quieter month for the nation’s property markets amid the Easter and Anzac Day long weekends.

While April is typically a slower month for property markets around the nation, property market activity has been consistently slower this year than last.

In part, that reflects just how busy property markets were during the early months of 2022 – the start of 2022 was the busiest first quarter of new listings since 2014. This year has not kept pace with that very busy mark.

Download the PropTrack Listings Report - April 2023

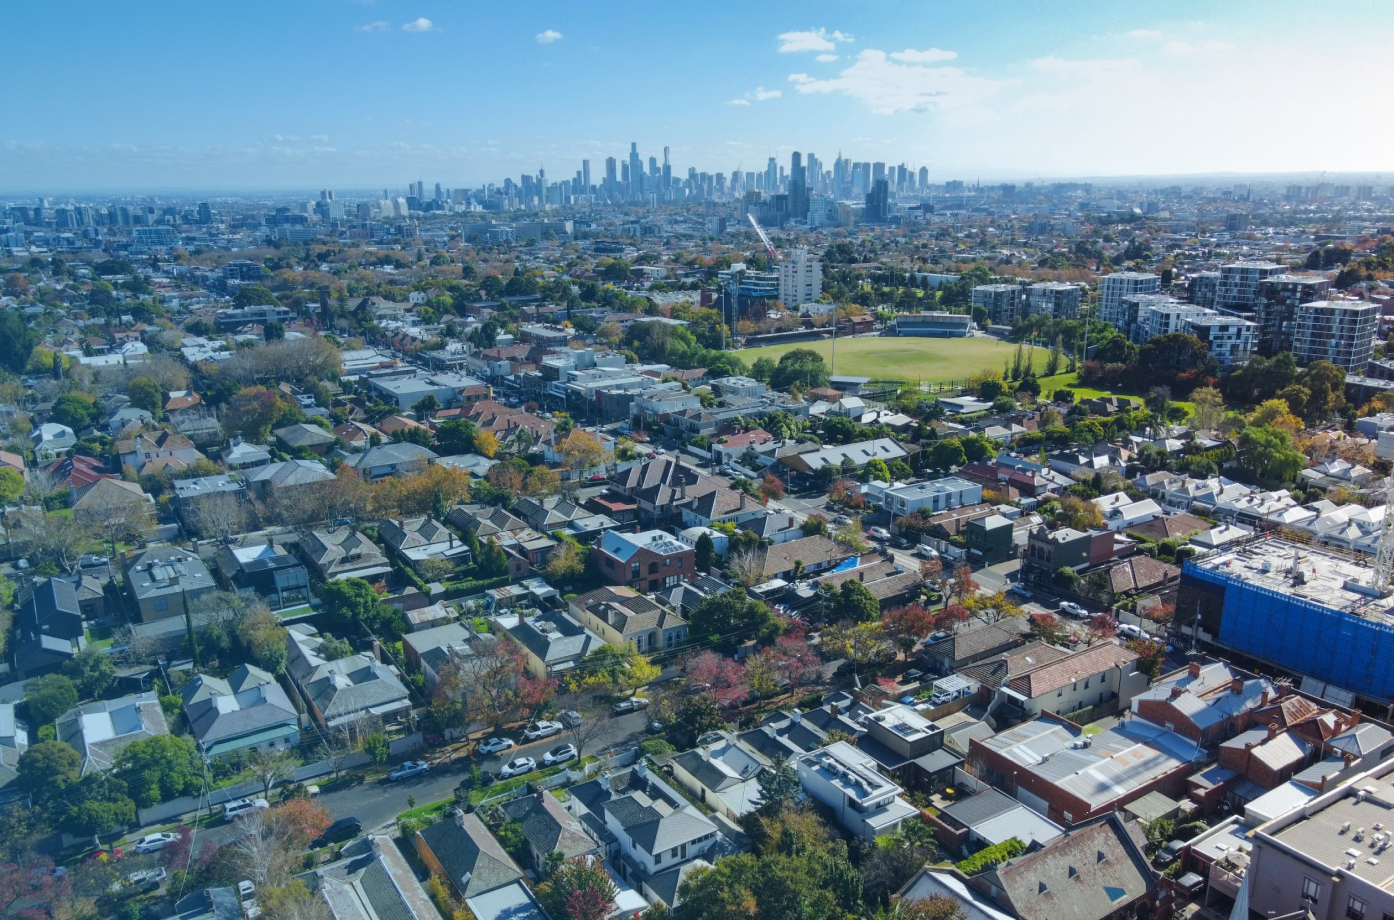
The total number of properties listed for sale in April was 5.6% higher than a year earlier, giving would-be buyers more choice. Picture: Getty


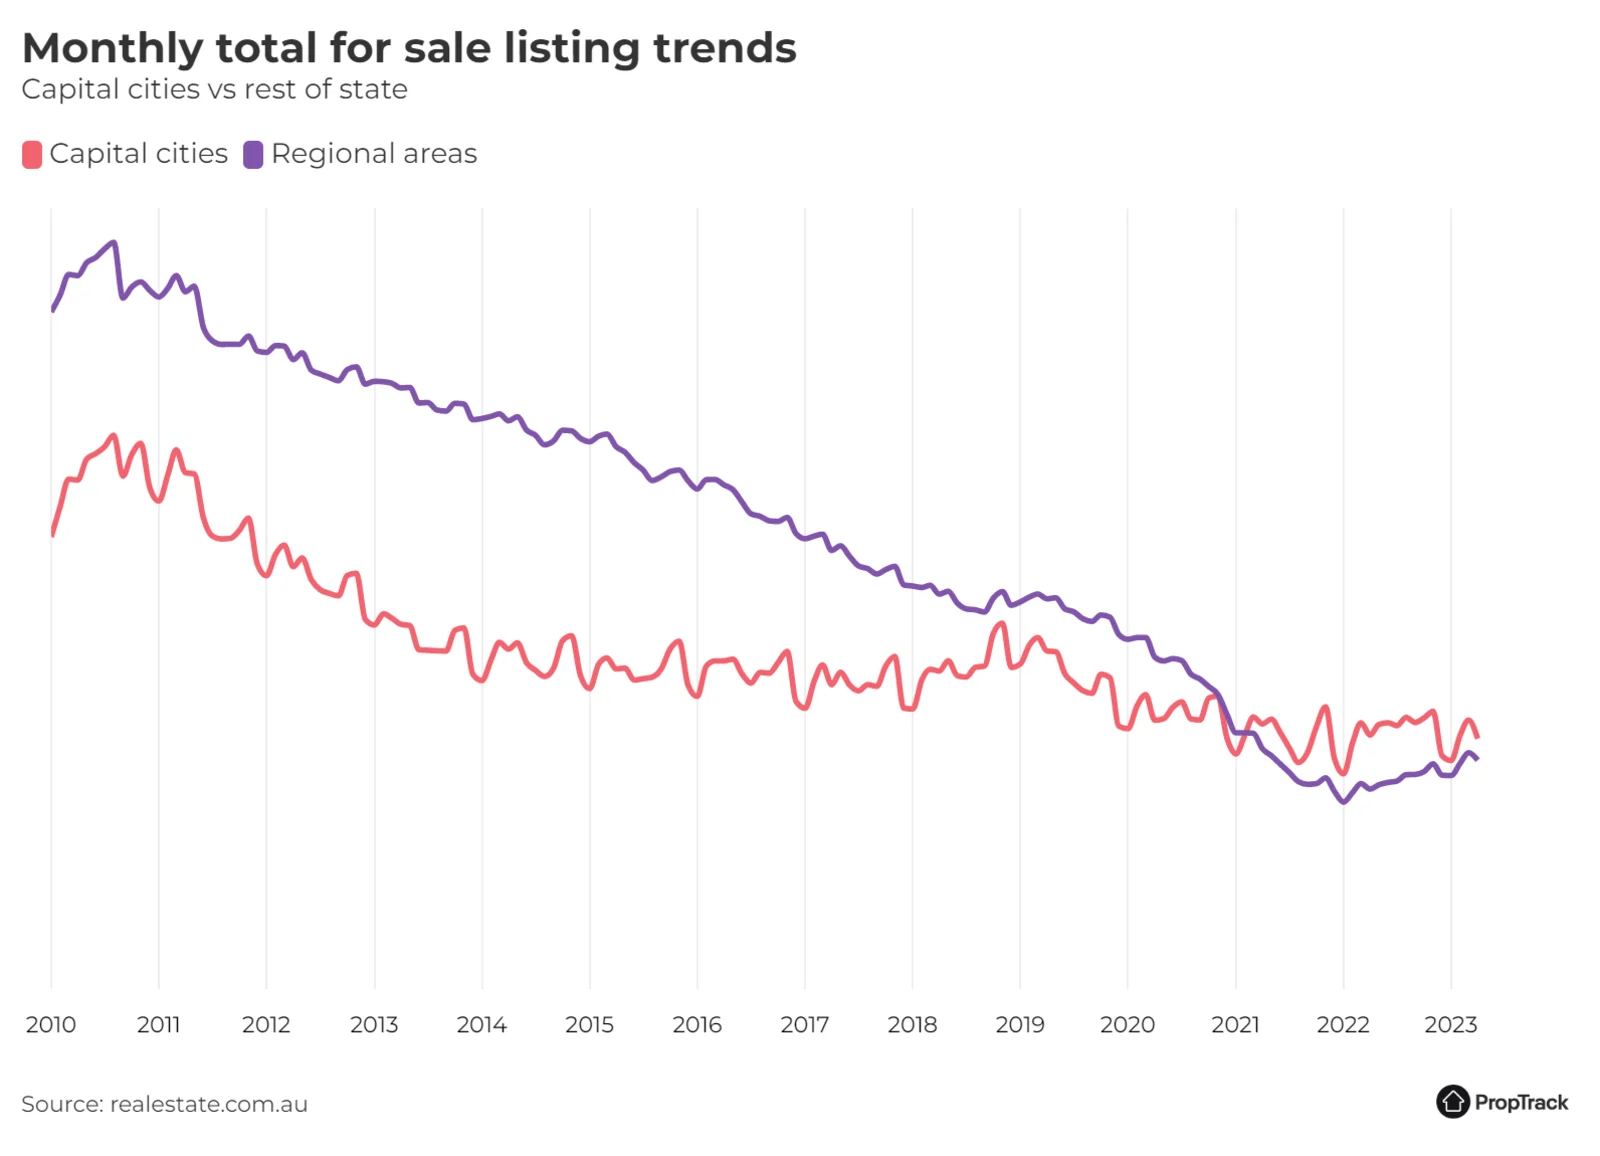
Although it was a slower month of new listings, the total number of properties available for sale has improved compared to a year ago, and compared to the low levels seen during 2021, which is helping give buyers more choice. This is particularly true in some regional areas, where choice was extremely limited during the pandemic.

This monthly report analyses new and total listings on realestate.com.au to provide the most up-to-date view on property market supply trends.

Executive summary

April was a quieter month than March across the nation’s property markets, as is usually the case due to the Easter and Anzac Day public holidays. While April is usually a quieter month, this year saw slower market conditions than was the case in 2022. This is consistent with the trend in slower activity throughout the start of 2023, relative to 2022.

Nationally, new listings on realestate.com.au decreased 28.3% month-on-month.
Compared to last year, new listings were down 23.5% in April.

The slower month was seen across the capital cities, with all cities seeing new listings down around a quarter to a third compared to March. In sum across the capital cities, new listings were down 29% month-on-month.

All capitals also recorded fewer new listings compared to a year ago, with new listings in the combined capital cities down just under a quarter year-on-year (-24.9%). While a notable decline, it in part reflects the busy pace of activity seen in early 2022.

Both Sydney and Melbourne recorded around a quarter fewer new listings this April compared to last year (down 24.9% and 22.5%, respectively). Darwin and Adelaide recorded the smallest year-on-year declines, but both still saw new listings down around one-sixth compared to a year ago.

Regional areas also saw new listings decrease in April, down 27.2% month-on-month. As with capital cities, 2023 has not kept pace with the busy mark set in 2022, and new listings in April were 21.4% lower than a year ago.

The slower month of new listings meant choice for buyers declined a little in April (as measured by the total number of properties available for sale). Even so, choice has improved compared to a year ago, and compared to the low levels seen during 2021. This is particularly true in regional Victoria and regional NSW.


While the total number of properties listed for sale declined in the month in both Sydney and Melbourne, both remain above their pre-pandemic level. And in Melbourne, the total number of properties listed for sale was above the average over the past decade. In Sydney it slipped a little below after being above-average last month.

Hobart has seen an extremely sharp increase in the total number of properties listed for sale, with 66.9% more properties for sale compared to a year ago. There are more properties listed for sale in Hobart than at any time since 2017 (aside from last month, which was higher again).

The total stock of properties listed for sale has been improving in some regional areas, especially regional NSW, Victoria, and Tasmania. While the total number of properties listed for sale in these areas is still below its pre-pandemic level, it has improved markedly over the past year. In other regional areas, the number of properties available for sale is still lower than a year ago.

Where to from here?

Property markets have had a quieter start to the year than was the case in 2022. That slowdown comes after an extremely busy period in early 2022. With the majority of the autumn selling season now behind us, we expect market activity will remain quieter over the next few months, as it usually does heading into, and during, the quieter winter period before picking up again for spring.

Home prices continued to increase slightly in April for the fourth consecutive month. While the increases have been modest, it is a change from the consistent price falls seen throughout much of 2022 when the RBA was raising interest rates very quickly.

While selling conditions are softer than a year ago, and market activity has slowed, market conditions have improved from late 2022. Auction clearance rates have remained reasonably firm through autumn, and have picked up compared to the second half of 2022.

While selling conditions are softer than a year ago, and market activity has slowed, market conditions have improved from late 2022. Auction clearance rates have remained reasonably firm through autumn, and have picked up compared to the second half of 2022. Further out, the fundamentals of housing demand remain strong. Unemployment has remained close to multi-decade lows for much of 2022 and into 2023. Wages growth, while running slower than inflation, has started to pick up. International migration has also resumed, which will further add to housing demand. And rental markets are extremely tight across the country.

How listings are faring across Australia

New South Wales

Activity in Sydney’s property market was quiet in April, as new listings slowed down amid the public holidays.

  • Property market activity in Sydney slowed down in April. This is usually the case amid the public holidays and coming off March, which is typically the busiest month of the autumn selling season. New listings declined 28.2% month-on-month and were down a quarter (-24.9%) compared to a year ago, continuing the trend of slower market activity this year compared to 2022.
  • Fewer new properties hitting the market in April meant the total number of properties available in the month declined as well, reducing choice for buyers compared to March. Nonetheless, choice remains reasonably good, with the total number of properties listed for sale in April only around 6% below the average over the past decade, albeit 8.2% lower than a year ago.
  • The story was similar in regional NSW, where new listings declined 28.3% month-on-month amid the Easter and Anzac Day public holidays. As with Sydney, 2023 has been a slower period than 2022 for property market activity, with new listings in April down 18.8% year-on-year.
  • The good news for regional buyers is that choice has improved markedly over the past 18 months following tight conditions during the pandemic, though it declined a little in April. Compared to a year ago, the total number of properties available for sale in regional NSW was up 34.5% compared to a year ago.

Victoria

Melbourne’s property market had a slower April than March, as the Anzac and Easter public holidays cooled activity.

  • As is usually the case, April saw fewer new listings than March amid the Easter and Anzac Day long weekends. New listings were down 26.9% month-on-month. While April is usually a slower month in property markets, this April was quieter than last year, with new listings down 22.5% year-on-year.
  • Fewer new listings coming to market in April meant that the total number of properties listed for sale declined, reducing choice for buyers a bit and unwinding the increase in March. Nonetheless, the total number of properties listed for sale remains around the average over the past decade and is broadly in line with last year (+0.4% year-on-year).
  • Property markets in regional Victoria also had a quieter, public-holiday-affected month. April saw 28.4% fewer new listings than in March. Like Melbourne, it has had a slower year than in 2022, meaning new listings were down 19.9% year-on-year.
  • The good news for regional buyers is that even with fewer new properties coming to market in April, there has been a substantial increase in the total number of properties listed for sale over the past year or so, greatly improving choice. The total number of properties listed for sale in March was up 40.7% compared to a year ago and is only around 9% below its pre-pandemic level.

Queensland

April was a quieter month for Brisbane’s property market, as activity slowed for the long weekends.

  • Activity in Brisbane’s property market slowed in April due to the Easter and Anzac Day long weekends, as is usually the case. New listings were down 28.9% month-on-month in April.
  • While April is typically a slower month, activity in Brisbane’s property market has been more subdued this year than it was last year, and that continued in April. New listings were down 31.6% year-on-year in April.
  • Fewer new properties on market meant that choice declined for buyers in the month. But the good news for buyers in Brisbane is that, even with April’s decline, there is more choice than a year ago. The total number of properties listed for sale in April was 5.3% higher than at the same time last year.
  • New listings also declined in regional Queensland, as is usually the case in April. New listings regionally were down 26.9% month-on-month. As in Brisbane, market activity this year has been more subdued than in 2022, and that continued in April. New listings in April were down 25.6% year-on-year.
  • Unfortunately for regional buyers, choice remains restricted. The total stock of properties listed for sale declined a little in April (-3.8% month-on-month). It is down a bit below last year (-3.3% year-on-year) and well below pre-pandemic levels (-45%).

South Australia

Choice for buyers in Adelaide is a little better than a year ago, but it remains limited after significant declines during the pandemic.

  • Property market activity slowed down in Adelaide in April after the typical peak of the autumn season in March. New listings declined 30.1% month-on-month in April.
  • As has been the case throughout the start of 2023, Adelaide’s property market has been quieter than in 2022. There were fewer new listings this year than last, down 18% year-on-year.
  • Choice for buyers declined a bit in Adelaide after a few months where it had started to improve. Even so, the decline in April was not enough to overwhelm the uplifts made during the start of the year and the total number of properties listed for sale has improved a little compared to a year ago. The total number of properties listed for sale in Adelaide was 3.5% higher than April 2022. While not a large increase, the start of this year is the first time Adelaide has had more properties listed for sale than a year ago since late 2019.
  • The story was similar in regional markets, with market activity slowing amid the public holidays. Regional SA saw 23.3% fewer new listings in April compared to March.
  • Choice for buyers remains very limited in regional SA, and declined modestly in the month as fewer new properties hit the market. The total number of properties available for sale in regional SA is down by about 60% compared to pre-pandemic levels and still 2.6% lower than this time last year.

Western Australia

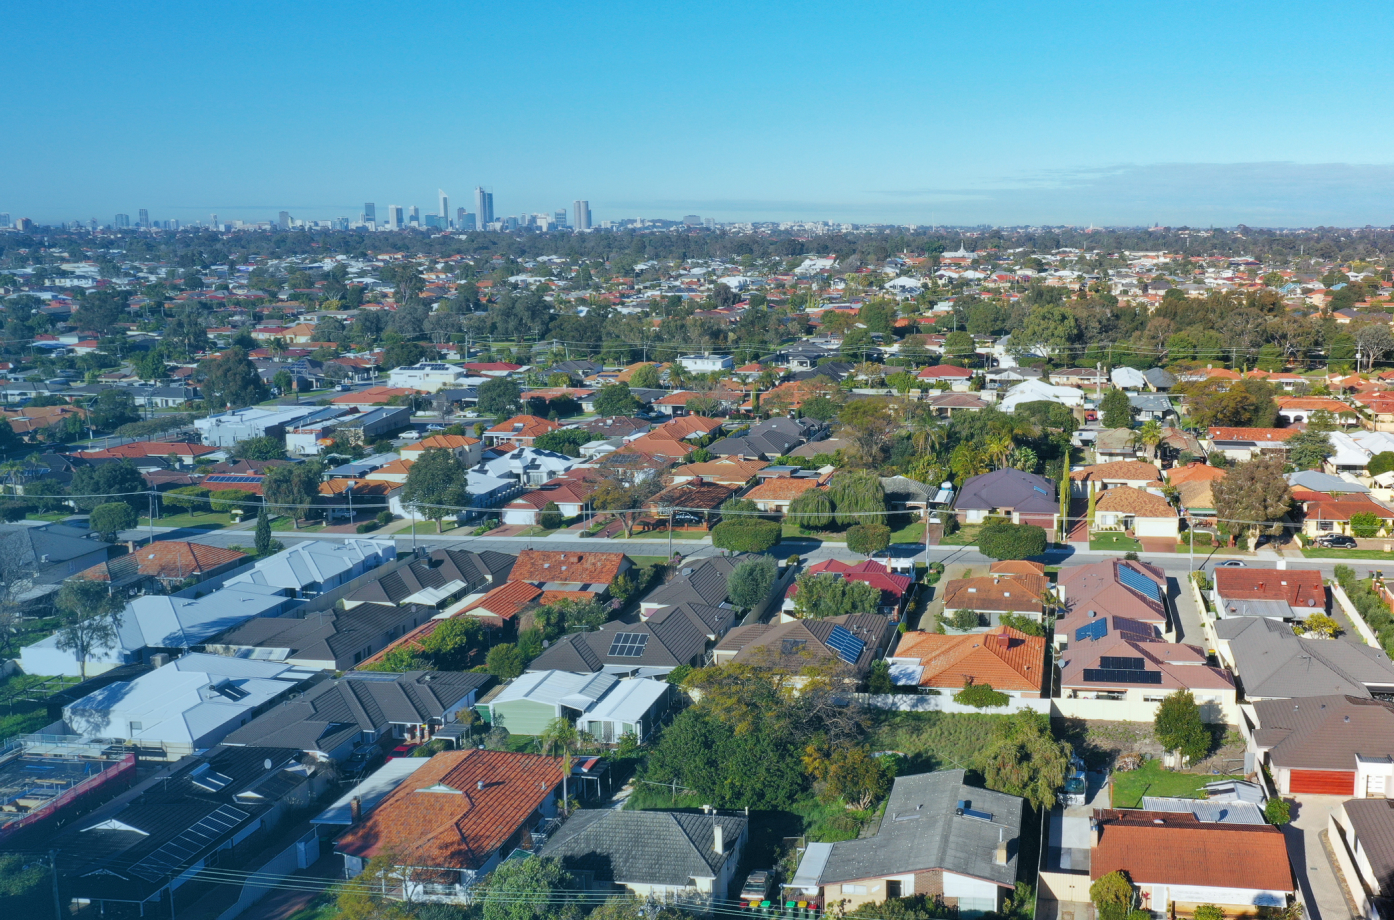
Choice remains extremely limited for buyers in Perth, with the total number of properties listed for sale close to its lowest level ever.

  • April was a quieter month in Perth’s property market, with activity slowing for the public holidays, and ahead of the typically quieter part of the year in winter. New listings were down 32.2% compared to March. While April is normally a quieter month after the typical peak of the autumn selling season in March, this year has seen fewer new listings than last year’s busy pace. New listings in April were 26.3% lower than a year ago.
  • Options remain very tough for buyers in Perth, as has been the case for a while. Fewer new properties hitting the market in April meant the total number of properties available for sale declined further, down 6.2% month-on-month, from already low levels. That decline means the total number of properties available for sale in Perth is only just above its lowest level ever, which it reached in January.
  • New listings in regional WA also declined in April amid the public holidays, down 26.1% month-on-month. Like Perth, market activity throughout the start of 2023 has been quieter than a year ago, and that continued in April. The number of new listings regionally was down 23.6% compared to a year ago.

Tasmania

Hobart’s property market showed signs of finally starting to slow in April after a very busy start to 2023

  • Hobart’s property market started to show signs of slowing down after a very busy start to 2023. As is typically the case in April, new listings were down sharply compared to March (-34% month-on-month) amid the public holidays. But unlike March, which was the second-busiest month since 2018, April was quieter than a year ago. This could be a sign that momentum in Hobart’s property market is starting to fade.
  • The story was similar in regional Tasmania, with new listings down 22.6% month-on-month due to the public holidays.
  • While April was a bit quieter, the busy past year of new properties hitting the market means buyers in Hobart are enjoying significantly more choice than was the case throughout much of the pandemic. In April, the total number of properties listed for sale in Hobart was still a staggering 66.9% higher than a year ago, even despite fewer new properties hitting the market. This means the total number of properties available for sale is around its highest level since early 2017.

Northern Territory

The long weekends in April meant Darwin’s property market had a quieter month.

  • Activity in Darwin’s housing market slowed in April, as is typically the case with the long weekends. New listings in April were down 22.8% month-on-month. While April is typically a seasonally quieter month, activity this year was quieter than last year. New listings were down 15.4% year-on-year.
  • The quieter flow of new properties hitting the market meant there were slightly fewer total properties available for sale in April than in March, reducing choice for buyers a little (-0.4% month-on-month). Even so, choice remains reasonably good for buyers in Darwin. The total number of properties available for sale is higher than last year (+4.3%) and only slightly below where it was pre-pandemic.
  • New listings were also down in regional NT amid the public holidays but were much higher than at the same time last year (+53.7%). However, listings activity in regional NT can be volatile as it is a small market with relatively low activity each month.

Australian Capital Territory

April was a quieter month in in Canberra’s property market as activity slowed for the public holidays

  • April saw a decline in listings activity in Canberra’s property market after the typical peak of the Autumn selling season in March and the Easter and Anzac Day long weekends. That slower pace meant that new listings were down 37.7% month-on-month in April.
  • As has been the case for much of this year, activity has not kept pace with the very busy mark set in 2022. Compared to a year ago, Canberra saw 21.3% fewer new listings this April.
  • The quieter month of new properties hitting the market meant that the total number of available properties also declined in April, down 10.7% month-on-month. While a notable decline, the total number of properties available for sale remains at a reasonably high level, with 13.3% more properties available for sale than a year ago.

Methodology

The ‘PropTrack Listings Report’ details monthly changes in the number of properties listed for sale on realestate.com.au. The listings are split into ‘new’ and ‘total’ listings.

New listings consist of properties that were newly listed for sale on realestate.com.au within the reported month.

Total listings is the total supply of properties for sale in the reported month. It consists of all listings which were for sale during that month (including new listings) irrespective of the date they first appeared on site.

The geographical areas described in this report are based on the Greater Capital City Statistical Area (GCCSA) as defined by the Australian Bureau of Statistics.

Disclaimer: PropTrack Listings Report is summary information only. realestate.com.au Pty Limited [REA] makes no representation whatsoever about PropTrack Listings Report’s completeness or accuracy. REA is under no obligation to update or correct any of the PropTrack Listings Report data or to continue to make the PropTrack Listings Report available. REA recommends that any users of the PropTrack Listings Report exercise their own skill and care with respect to their use of the PropTrack Listings Report and that users carefully evaluate the accuracy, currency, completeness and relevance of the PropTrack Listings Report for their purposes. REA expressly bears no responsibility, and accepts no liability, whatsoever for any reliance placed by you or others on the PropTrack Listings Report, or from any use of the PropTrack Listings Report by you or others. If you wish to cite or refer to this report (or any findings or data contained in it) in any publication, please refer to the report as the ‘PropTrack Listings Report – April 2023′.

Related Stories


Request a demo

A PropTrack advisor will call you back to organise an demonstration

Lorem ipsum dolor sit amet, consectetuer adipiscing elit. Phasellus hendrerit. Pellentesque aliquet nibh nec urna. In nisi neque, aliquet vel, dapibus id, mattis vel, nisi. Sed pretium, Nullam mollis. Ut justo. Suspendisse potenti. Privacy Policy